
The Accurate Labor Model Playbook
How to Align Staffing with Demand for Lower Labor Costs and Better Operations
Key Takeaways
- What it is: A simple system that turns your forecast (sales/orders) into hours by role and time without guesswork.
- Why now: Off-premise is still elevated, wages are higher, and scheduling rules are tighter, meaning small misses cost more.
- Quick start: List big tasks, tag fixed vs variable, map to roles, set minimum crew + rules, then calibrate with last month's data and align to financial targets.
- Coach managers: Track earned vs actual daily; if there’s a gap, ask: forecast, schedule, or execution? Use AI to help build business acumen.
- Payoff: Lower labor %, better service, faster scale. Many teams see 1–3 pts labor-cost improvement.
Why Precise Staffing Matters
Customer demand looks different than it did in 2019. Takeout, delivery, and drive-thru make up a much bigger slice of sales now, which shifts the work from table service to prep, packaging, and hand-off. Peaks are sharper and don't always line up with dine-in patterns, so "set it and forget it" schedules fall short.
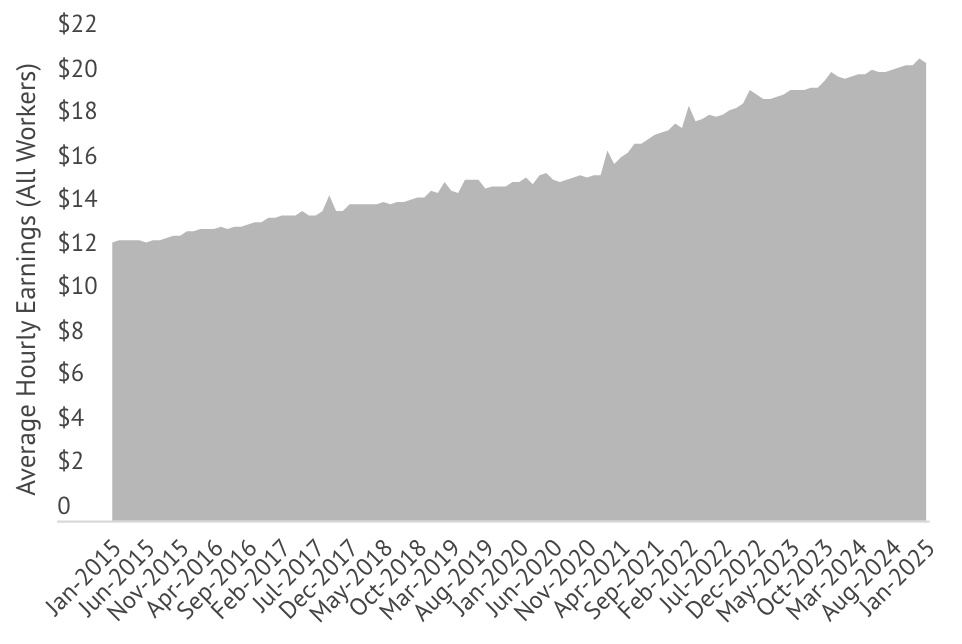
Labor is also more expensive. With higher wages, a single extra person on a slow hour quietly drains profit, multiplied across stores and weeks, it's real money. In a tight-margin business, you can't afford routine overstaffing or chronic understaffing that hurts service and sales.
Rules have tightened, too. Predictive-scheduling and wage-and-hour enforcement mean last-minute changes or missed breaks can trigger penalties. Schedules must be both efficient and compliant.
Bottom line: volatile demand + higher wages + stricter rules = guessing is costly.
The fix: an accurate labor model converts your forecast into the right people, at the right times, in the right roles, protecting margin, keeping lines moving, and reducing compliance risk.
Labor and Food Costs climbing twice as fast (or more) as restaurants can raise prices.
What Is a Labor Model, Really?
A labor model is a simple recipe for staffing. It turns your forecast (sales, orders, traffic) into hours by role and time block, so you're not guessing "5 people should cover it." Think of it like cruise control: it sets the right speed, and managers still steer.
How it works:
- Inputs: what drives work (orders, transactions, foot traffic) + realities (hours open, minimum crew, break rules).
- Logic: basic standards (time per task) for each role.
- Output: "Tomorrow needs 100 total hours: 40 kitchen, 30 registers, 20 prep/clean, 10 manager," spread across the day where demand is.
Example:
If serving one order needs 3 min cashier + 5 min cook, then 200 orders = 10 cashier hours + ~16.7 cook hours. Add fixed work (e.g., 60 min to open) and you've got your plan. The model handles both variable (per order) and fixed (always) tasks.
- Not a flat % of sales. A single ratio can't staff a slow 10am and a busy 12pm the same. A good model flexes with peaks and lulls.
- Still manager-friendly. It's a baseline you can tweak for real-life issues (call-outs, events). Less guesswork, faster schedules.
- Why bother? One shared playbook means consistent staffing, easier new-store launches, and decisions based on data, not gut.
So what? The model gives you the right people, at the right times, in the right roles, protecting margin and service.

Building an Accurate Labor Model
1. Pick your workload drivers
What creates work? Use 1–3 drivers per area (e.g., transactions, items made, foot traffic, plus channel mix like dine-in vs delivery). Add location flags (drive-thru, catering) if they change work.
2. List tasks and time
For each routine, estimate fixed time (always needed—e.g., open = 60 min) and variable time (per unit—e.g., make burger = 2 min). Rough numbers are fine to start.
3. Map tasks to roles
Tie each task to a role/department (cashier, cook, prep, manager). This lets the model output hours by role instead of one big blob.
4. Tag service vs support
Service work must match customer timing (orders, hand-off). Support work (prep, cleaning, restock) can move to slow periods. This is key for smarter scheduling.
5. Add real-world guardrails
Minimum crew, required roles on duty, hours of operation, break rules, minors, overtime limits, and "no clopen". The model should never suggest an illegal/impractical plan.
6. Build the first pass (keep it simple)
Use a spreadsheet or tool to convert forecasted drivers into hours: Needed hours = fixed time + (variable time × volume) by 15–60 min blocks. Focus on the big drivers (≈80% of hours). You can refine later.
7. Calibrate with history
Back-test against a good week. If model said 90 hours and the store used 100 (with solid service), adjust standards. Many tools auto-fit to historicals. Add a proficiency knob if newer stores run slower.
8. Plan safely and align to budget
Create a what-if sandbox (e.g., +10% sales, longer hours, add drive-thru). Compare earned hours from the model to Finance's target; close gaps by refining standards or revisiting the target.
9. Package for the field
Feed outputs into auto-scheduling, give a one-page standards sheet, and review earned vs actual weekly using the simple diagnostic: forecast, schedule, or execution?
Mini example:
200 orders × (3 min cashier + 5 min cook) = 10 cashier hrs + 16.7 cook hrs, plus fixed: open = 60 min manager.
So what? In days (not months), you'll have a living playbook that flexes with demand, trims waste, and makes schedules faster and fairer.

Labor Standard Spec Template
Use a table like the one below to define each labor standard in your model.
| Standard Name | Trigger/Driver | Fixed Time | Variable Time | Role/Dept | Service or Support |
|---|---|---|---|---|---|
| Opening Prep | Store opening (daily fixed) | 60 min | 0 min per store/day | Manager | Support |
| Grill Burgers | # of burgers ordered | 0 min | 2.0 min per burger | Kitchen (Cook) | Service |
| Cashier Transactions | # of transactions (dine-in) | 0.2 min (per shift setup) | 1.5 min per transaction | Front Counter (Cashier) | Service |
| Clean Dining Area | Hours open (frequency) | 0 min | 5 min (each hour) | Busser | Support |
| (Add rows for all key tasks and routines...) | |||||
From Plan to Schedules: Let Auto-Scheduling Do the Heavy Lifting
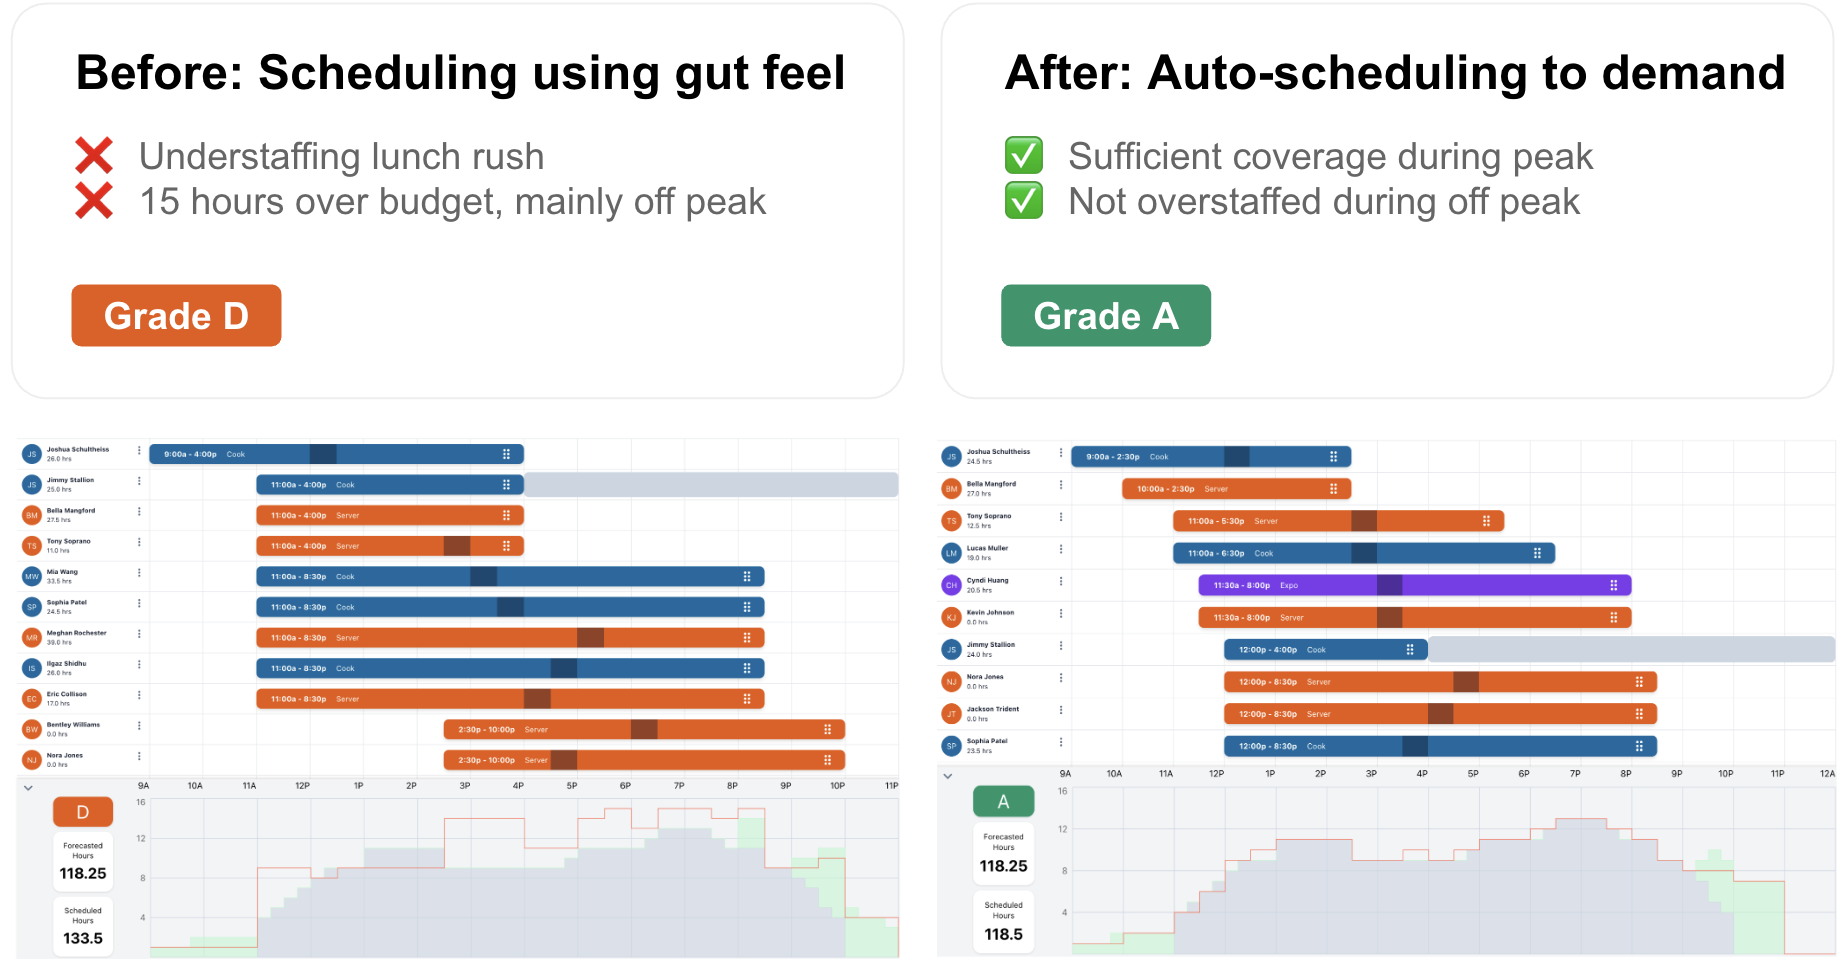
Your labor model says how many hours you need by role and time. Auto-scheduling turns that into a real roster, matching demand while honoring availability, break rules, minor laws, overtime limits, no "clopen", and your company policies.
Instead of blunt 8-hour blocks, the system creates staggered starts and overlaps that thicken coverage at lunch/dinner and thin it during lulls. Example: 3 people at 8am, add 2 at 11am for the rush, drop 2 at 2pm. Same sales, less idle time and fewer "we're slammed" moments.
Managers still control the outcome. The tool drafts a schedule in seconds; the manager reviews and tweaks (swap a person, respect a preference, handle a conflict). The math and constraint-checking happen behind the scenes—so managers spend minutes, not hours, and get a better fit to the demand curve.
Why it matters:
- • Cuts waste (fewer low-value hours in slow periods).
- • Protects service (right people at peaks).
- • Boosts consistency across locations (same logic everywhere).
- • Reduces risk by baking in compliance rules.
So what? Auto-scheduling operationalizes your model, delivering tighter staffing, happier guests, and lower labor % without turning managers into spreadsheet jockeys.
Better Forecasts = Better Schedules
Your schedule is only as good as the forecast behind it. If the forecast is low, you'll be short-staffed. If it's high, you'll pay for idle time. The fix is a forecast that's granular, unit-based, and continuously improved.
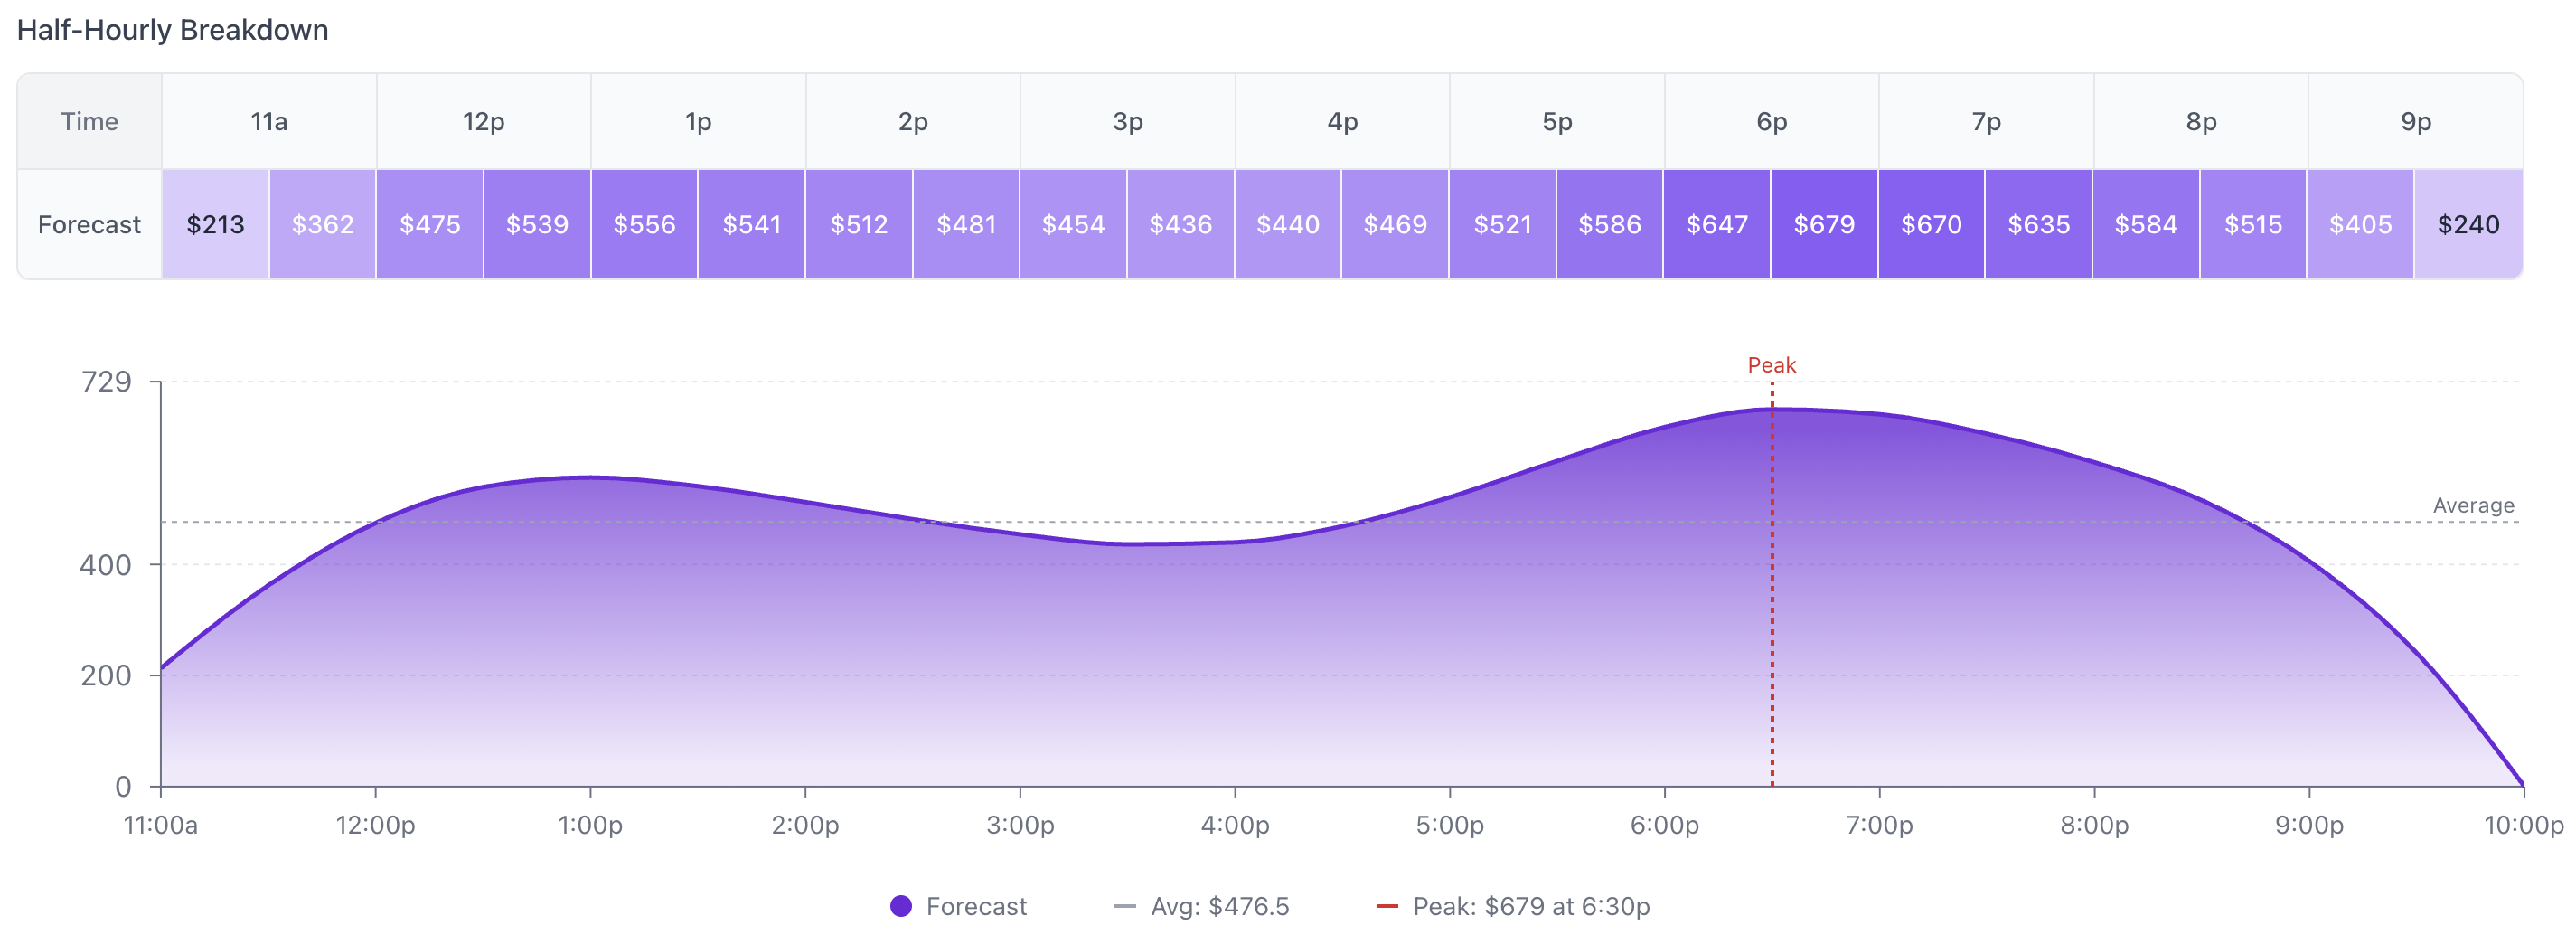
Go beyond daily totals
Forecast hourly or 15-minute demand by channel (dine-in, delivery, drive-thru). The same $10k day can be a steady trickle or two big rushes. Staffing should match the shape, not just the sum.
Forecast units, not just dollars
Four $10 orders usually take more labor than one $40 order. Include transactions/items/menu mix so the model sees real workload.
Use all the signals
Pull in day-of-week, seasonality, promos, weather, local events. Let managers add local knowledge (parades, school games), and track override accuracy so the system learns who's reliably right.
Close the loop
After each day, compare forecast vs actual. Log misses by time/channel, coach where needed, and tune the model. Accuracy improves, and so do schedules.
So what? A detailed, learning forecast feeds your labor model the right inputs, producing schedules that meet peaks, trim slow-time waste, and protect both service and margin.
Making It Work in the Field
Start small, prove it
Pilot 2–3 stores with average performance and open-minded managers. Run the model alongside current scheduling for a short period, then switch over and capture wins to share.
Train and explain (no black box)
Show how the model converts demand into hours by role and why peaks get more coverage. Provide a one-pager/cheat sheet and short Q&A sessions so managers see it as help, not control.
Coach, don't police
Use reports for learning: review earned vs actual weekly and ask the simple diagnostic: forecast, schedule, or execution? Allow a small flex band (e.g., ±5%) for local realities.
Measure and iterate
Track labor % of sales, speed of service, and guest feedback. Spotlight wins and investigate misses with data (e.g., chronic overage, under-forecasted dayparts). Share best practices and adjust standards where patterns emerge.
Keep it fresh
Assign ownership to maintain the model. Update for menu/process changes, new channels, or policy shifts, and do periodic recalibration against actuals.
What teams experience:
Skepticism fades after a few pay periods as targets get easier to hit and service steadies. Managers spend less time building schedules and more time leading teams.
So what? Blend tech with people: pilot, teach, coach, measure, and maintain. That's how the model becomes a better way of working, not extra work.

Common Pitfalls (and quick fixes)
Forecasting too high-level
Daily/weekly $ hide peaks and lulls.
Fix: Forecast hourly/15-min and in units (transactions/items), not just dollars.
Treating labor as one bucket
Flat % cuts hit the wrong places.
Fix: Split by role and service vs support; tune each to its drivers.
Ignoring minimums & human reality
"1.3 people" at 3pm isn't workable (breaks, safety).
Fix: Set floor staffing (e.g., 2 on duty), round up, and fill slow time with support tasks.
Over-engineering the model
Hundreds of micro-standards = shelfware.
Fix: Start simple (big drivers covering ~80% of hours). Iterate with data.
Siloed tools and teams
Forecast, schedule, payroll don't talk → blame games.
Fix: Connect Forecast → Model → Schedule → Report (one platform or solid integrations) and review shared reports across Ops/Finance/HR.
Set-and-forget standards
Menu/process changes make the model drift.
Fix: Owner assigned; review quarterly (or after changes). Recalibrate with actuals + field feedback.
So what? Avoid these traps and you'll get tighter staffing, cleaner ops, and measurable labor % gains, without burning out managers.
Bringing It All Together — The Four Pillars
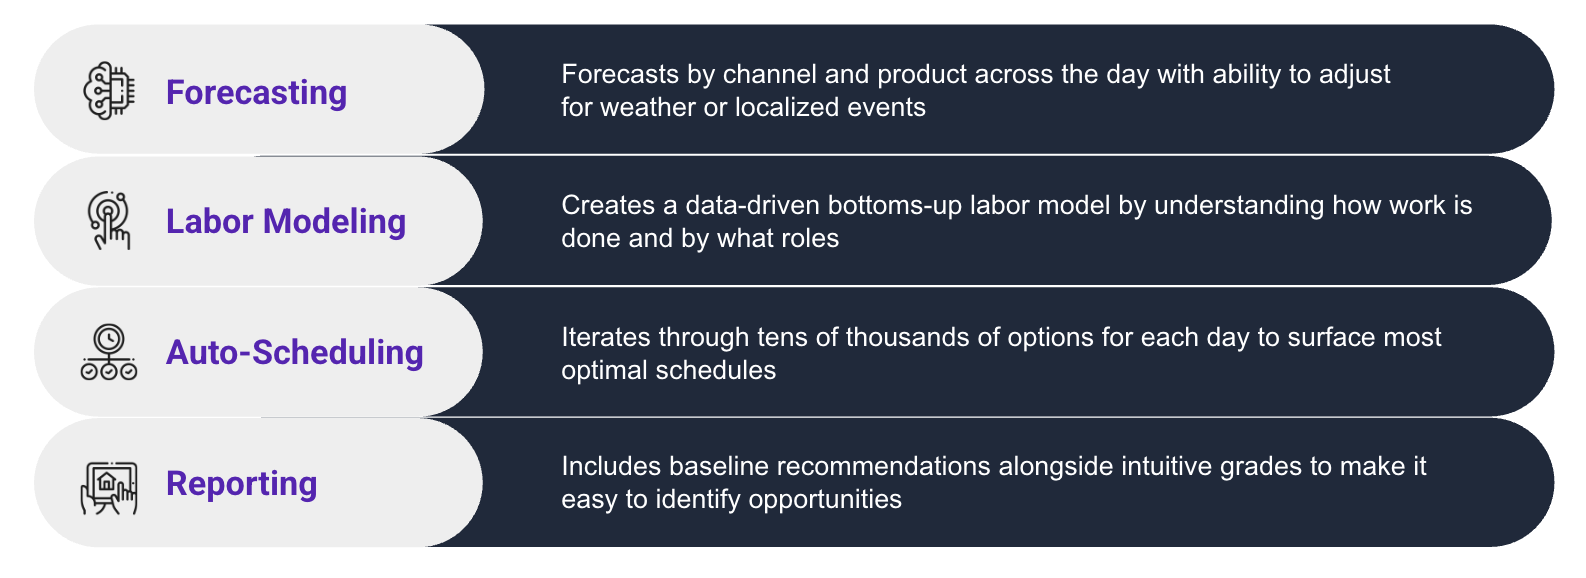
Think of labor planning as a loop with four parts that feed each other:
Forecasting → Modeling
Time and channel-level forecasts go into the labor model. Standards and rules turn demand into hours by role and time block. When the forecast shifts, the plan shifts.
Modeling → Scheduling
Required hours flow to auto-scheduling, which assigns real people while honoring availability, breaks, minors, overtime limits, and house rules. Managers review and tweak.
Scheduling → Reporting
As the week runs, you capture actual sales and hours. Reports show variances (earned vs actual, SPLH, overtime, compliance) by daypart and role.
Reporting → Model Tuning
Insights tune the system: raise the Friday 5–7pm forecast, update a cleaning standard that's light, or adjust scheduling rules where managers always override.
So what? With the four pillars synced, staffing becomes predictable, fair, and efficient: lower labor %, steadier service, happier teams, and a playbook that keeps getting better.
Mini Case Studies: Accuracy in Action
Case 1 - Kizuki Ramen & Izakaya (16 units, full-service)

After rolling out Rightwork's demand-based model and auto-scheduling, Kizuki cut labor percent from 24.6% → 23.3%, added +$28,314 profit per store over 80 days, and realized an annual profit lift >$1M across the chain. Managers also saved about 1 hour/week on scheduling.
Read full case study hereCase 2 - Evergreens (14 units, fast casual)

With clearer targets, better visibility, and an employee-friendly mobile app, Evergreens posted significant year-over-year sales comps and +10% Sales Per Labor Hour (SPLH), growing revenue while getting more out of every hour worked.
Read full case study hereWhat this means for you: Accurate modeling + auto-scheduling doesn't just trim hours. It protects margin, keeps lines moving, and gives managers an easier, more consistent way to staff. Whether your goal is lowering labor % a point or two, lifting SPLH, or freeing up manager time, these results show the upside is real and repeatable.
Summary & Next Steps
An accurate labor model turns demand signals into clear hours by role and time, so you're not overstaffed in lulls or short at peaks. In this guide, we covered why now (higher wages, tighter rules, off-premise mix), what "good" looks like (drivers, fixed vs variable time, service vs support, constraints), and how it all runs with the four pillars, Forecast → Model → Schedule → Report, in a feedback loop that keeps getting smarter. The payoff: lower labor %, steadier service, and easier scaling.
In short, accurate labor modeling turns labor into a competitive advantage rather than a cost liability. It gives your operators and managers the gift of predictability and control in an unpredictable world. Chains that master this will expand faster and more profitably than those that don't.
Ready to take your labor planning to the next level? Now is the time to act.
Take This Playbook With You
Download the complete PDF version to reference later, share with your team, or use as a guide during implementation.
References
Key sources for data and claims in this playbook
- National Restaurant Association - Off-Premises Restaurant Trends 2025 (2025)
- Stateline - "Hospitality workers' wages are rising faster..." (Jan 9, 2024)
- Economic Policy Institute - "Wage theft recovery 2021-2023" (Nov 2024)
- HR Dive - "Predictive scheduling laws - list of states and cities" (May 14, 2024)
- Rightwork Blog - "Importance of an Accurate Labor Model for Scaling" (2024)